Description
This product is modeled to teach:
-
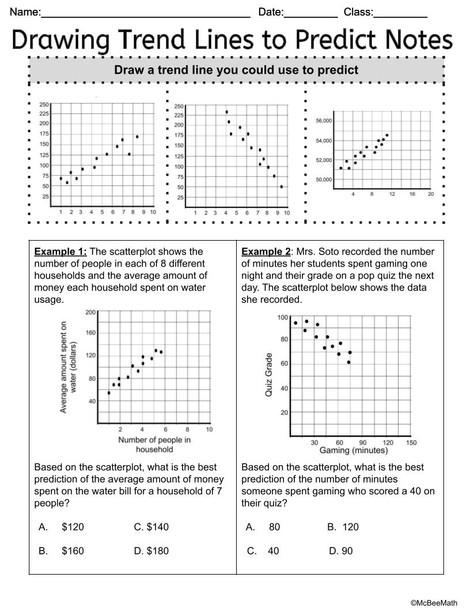
8.5(D) use a trend line that approximates the linear relationship between bivariate sets of data to make predictions
-
8.5(C) contrast bivariate sets of data that suggest a linear relationship with bivariate sets of data that do not suggest a linear relationship from a graphical representation
-
8.11(A) construct a scatterplot and describe the observed data to address questions of association such as linear, nonlinear, and no association between bivariate data
-
8.11(B) determine the mean absolute deviation and use this quantity as a measure of the average distance data are from the mean using a data set of no more than 10 data points
It includes a Scope and Sequence
-
Day 1: Construct a scatterplot
-
Day 2: Determine the association of a scatterplot
-
Day 3: Determine if graphical representations are linear
-
Day 4: Use a trend line to predict
-
Day 5: Use a trend line to predict
-
Day 6: Use a trend line to predict Task Cards
Each Day Lesson Design(s): Lessons are designed for a 50 minute class period
-
Student Notes taking page
-
Link to Pear Deck activity that accompanies student note taking page
-
Teacher Key with talking points and teaching strategies
-
Student Practice Worksheet
-
Exit Ticket
Check out McBeee Math for more resources

