Description
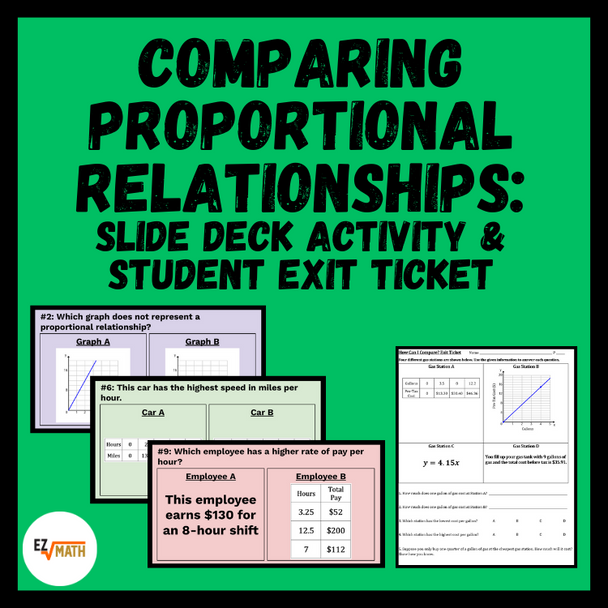
Want to know if your 7th grade math students can calculate a unit rate and compare proportional relationships in the same and different representation?
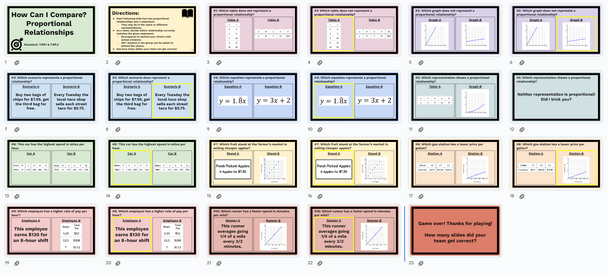
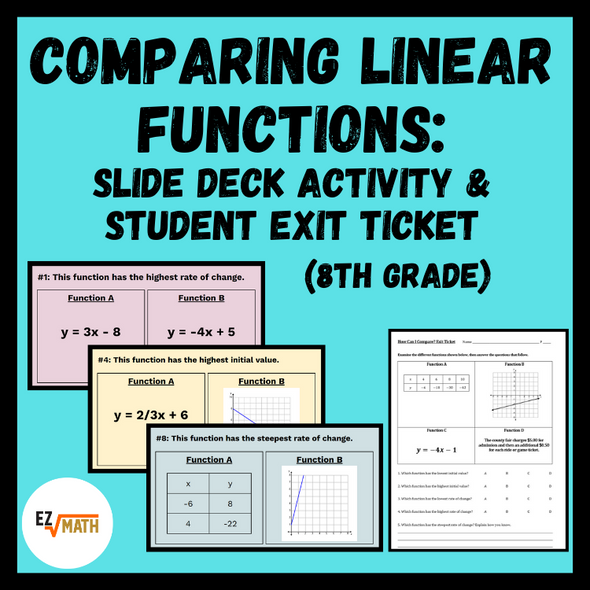
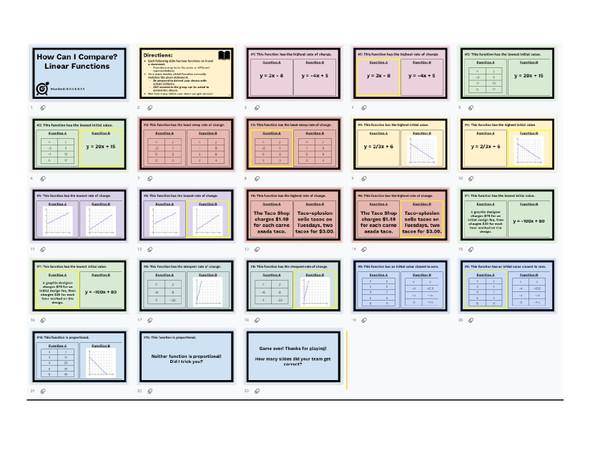
This presentation includes 10 questions (23 slides total) that has students work in groups to determine which statement is true between two given proportional relationships. Which has the higher unit rate? Which has the lower unit rate? Which of the two representations is actually proportional? Teams must be able to work together to determine the answer, then back up their answers verbally.
Great as a review activity before an exam, or as a mid-unit formative assessment to track progress towards mastery.
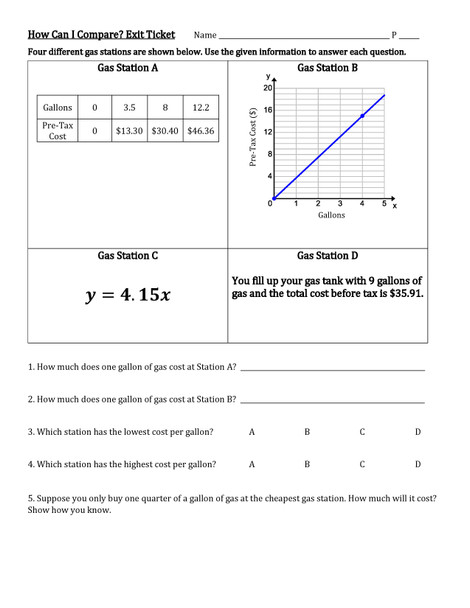
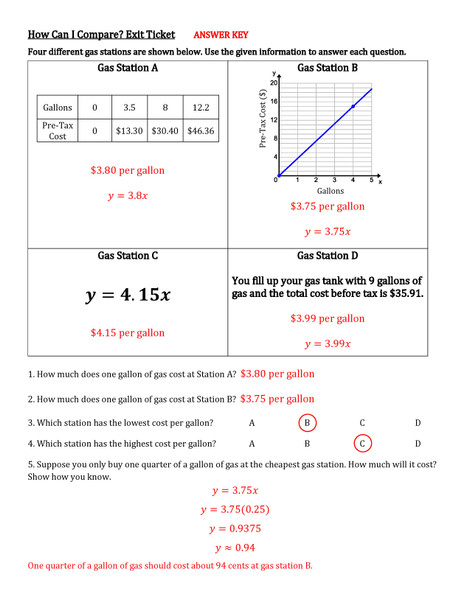
This lesson also includes a quick paper/pencil exit ticket students can do individually so you can assess each students' mastery of proportional relationships, with answer key included.
Included in Activity:
- Link to Google Slide Deck for classroom presentation
- Complete directions for how I like to run the activity
- Printable student answer choice cards
- Printable student Exit Ticket
- Complete Exit Ticket answer key
If you enjoy this activity, please check out my other products in my EZMath store.

