Supply and Demand Unit
- Bulk Pricing:
- Buy in bulk and save
- Contributor:
- Dan Nguyen
- Grade Level:
- High School
- Product Type:
- PPT with analysis activities
- File Type:
- Zipped files
- Pages:
- 3 PPT's and 3 Analysis activities
- Answer Key:
- Yes
Description
This unit contains 3 lesson plans that cover Supply and Demand and how the Price System works. There is also an additional review assignment to end the unit on.
For each lesson, there is a powerpoint that explains each concept, and then a short worksheet is assigned for students to apply their knowledge. Answer keys are provided for all worksheets.
The first lesson is over Demand. Students learn about what demand is and how the 6 determinants of demand affect it. The lesson begins with a 30 minute powerpoint that covers: 1. What demand is and how the demand curve works. 2. Difference between Demand and Quantity Demanded. 3. How the 6 determinants of demand affect the demand curve: a. Consumer Preferences b. Number of Consumers c. Consumer Income d. Price of Substitute Goods e. Price of Complimentary Goods f. Consumer Expectations
Afterwards, students complete a Worksheet to apply what they learned from the powerpoint.
The 2nd lesson is about Elasticity of Demand and also Supply. There is a 15-20 minute power point over each concept.
The first powerpoint covers: 1. Marginal Utility 2. The Law of Diminishing Marginal Utility 3. Elasticity of Demand 4. The Determinants of Elasticity of Demand
The 2nd powerpoint is about Supply and the Determinants of Supply. It covers: 1. Supply 2. Law of Quantity Supplied 3. How Determinants of Supply affect Supply a. Price of Resources b. Technology c. Taxes and Subsidies d. Number of Sellers 4. How a change in price affects the Supply graph versus how a change in the determinants of Supply affect the Supply graph.
After the 2 powerpoints, a worksheet is assigned for the students to apply their knowledge.
The 3rd lesson covers how Supply and Demand together form the Equilibrium Price and Quantity of a good. A 15-20 minute powerpoint covers: a. Equilibrium Price and Quantity b. Price Floors and Price Ceilings c. Shortages and Surpluses Afterwards, students are assigned a worksheet to apply their knowledge.
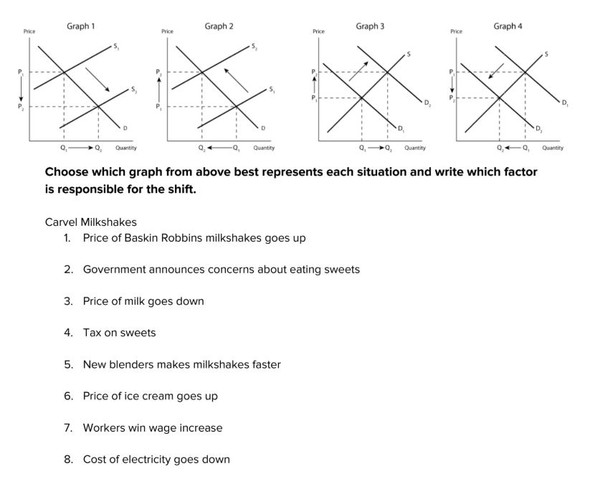
After the unit, there is an additional review assignment. Students read different scenarios and use that information to show how the Supply and Demand graph for a good changes. They then state how that change affects Price and Quantity.
Each Worksheet has about 10 questions and includes an answer sheet.
Created by Dan Nguyen - Visit My Store


