Data and Graphing | PowerPoint Lesson Slides Tally Chart Pictograph Bar Graph
- SKU:
- UPC:
- MPN:
MSRP:
Now:
$1.50
Was:
— You save
Description
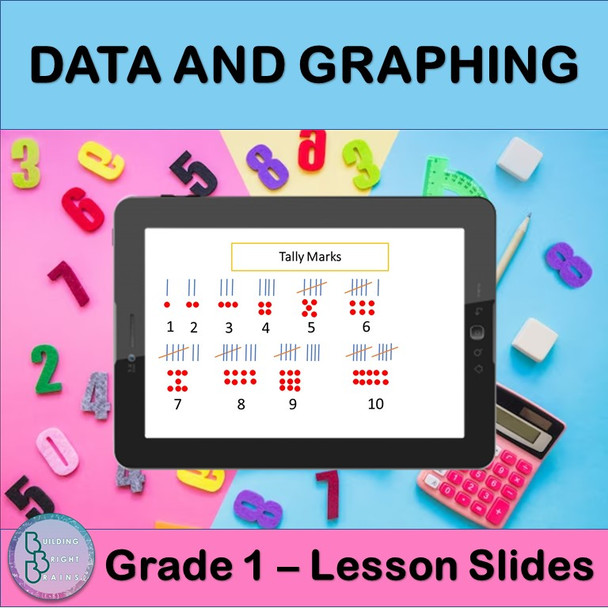
Are you teaching your students about Data and Graphing? This resource is great for you for First Grade! Plenty of examples and application exercises are included. You can also easily convert this to a Google Slides lesson by dragging it into your Google Drive.
What is included?
✦ 6 total slides for notes, examples and applications.
✦ All steps are animated to allow the teacher to explain them gradually.
At the end of the lesson, students will be able to
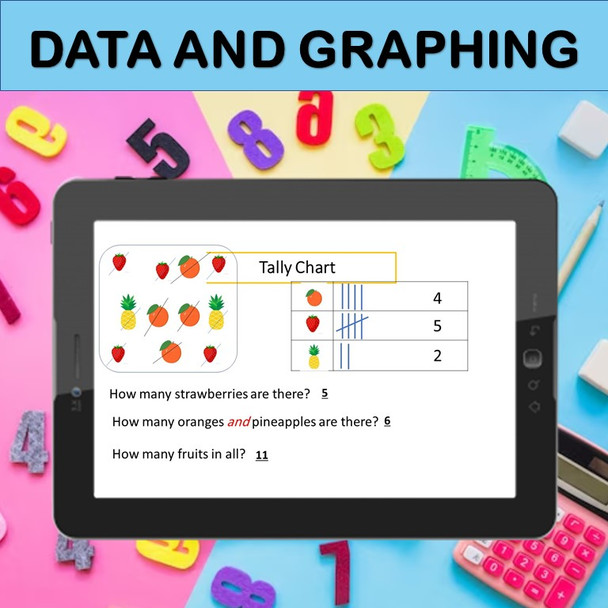
✦ Make a Tally Chart
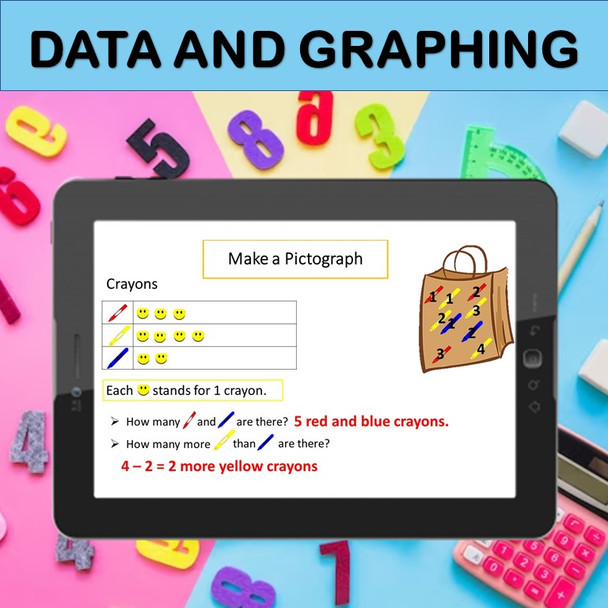
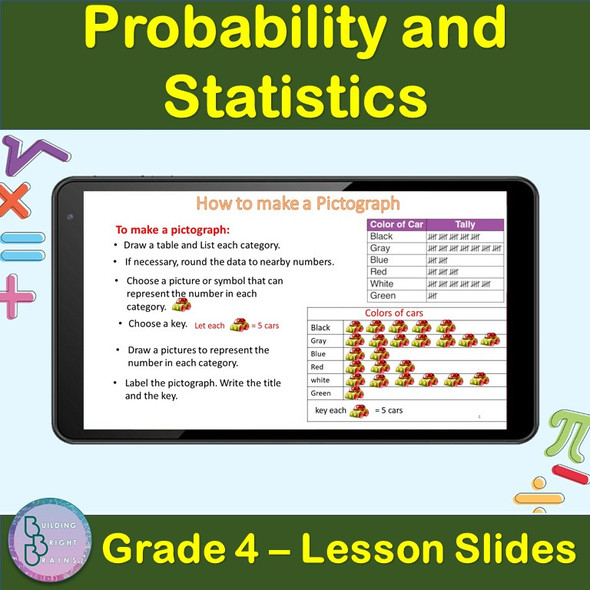
✦ Make a Pictograph
✦ Read a Pictograph
✦ Make a Bar Graph
✦ Read a Bar Graph
This resource is great for:
- In-Classroom Teaching (Displaying for the Whole Class)
- Online Learning
- Homeschooling
- Sharing on Google Classroom or Other Platforms as a Tool for Revision
Check out Building Bright Brains for more resources
Related Products
Related Products
Data and Statistics | 6th Grade PowerPoint Lesson Slides | Circle Graphs
MSRP:
Now:
$1.50
Was:
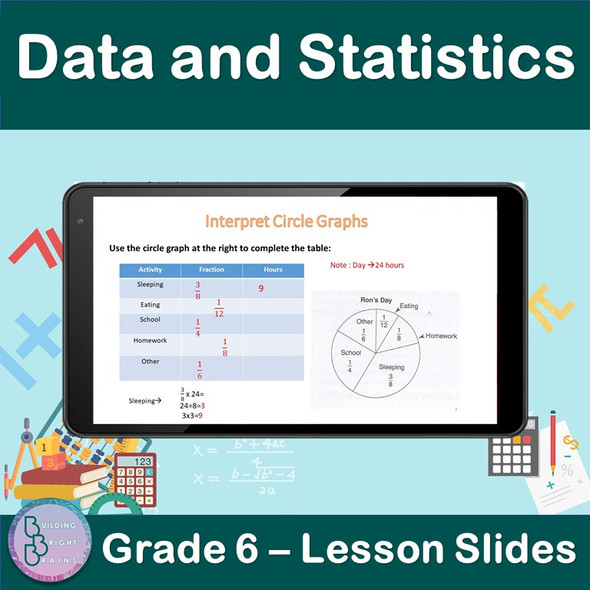
Are you teaching your students about Data and Statistics For 6th Grade? Plenty of examples and application exercises are included. You can also easily convert this to a Google Slides lesson...


3rd Grade Bar Graphs, Pictographs, Tally Charts & Line Plots Review Game Show
MSRP:
Now:
$4.00
Was:
Struggling to find a fun way to practice and review bar graphs, line plots, tally charts and pictographs with your 3rd grade class? This fun, interactive, game show style graphing math review...


Graphs, Bar Graphs, Circle Graphs, and Line Graphs - Digital and Printable
MSRP:
Now:
$3.00
Was:
Looking for a fun low-prep lesson on Bar Graphs, Circle Graphs, and Line Gra
Probability and Statistics | 4th Grade PowerPoint Lesson Slides Pictograph
MSRP:
Now:
$3.00
Was:
Are you teaching your students about Probability and Statistics For 4th Grade? Plenty of examples and application exercises are included. You can also easily convert this to a Google Slides...


Spring Graphs and Charts
MSRP:
Now:
$2.00
Was:
Looking for spring math activities? Spring Graphs and Charts is a fun, seasonal way to practice line graphs, pictographs, and bar graphs with a spring theme! This 10-page activity will not...


Winter Graphs and Charts
MSRP:
Now:
$2.00
Was:
Looking for winter math activities? Winter Graphs and Charts is a fun, seasonal way to practice line graphs, pictographs, and bar graphs with a winter theme!
This 10-page activity...


Fall Graphs and Charts
MSRP:
Now:
$2.00
Was:
If you are looking for fall math activities, Fall Graphs and Charts is a fun, seasonal way to practice line graphs, pictographs, and bar graphs with a fall theme!
This 10-page...

Back to School Graphing | Collect and Graph Board Game | Sorting and Bar Graphs
MSRP:
Now:
$4.00
Was:
Here is a fun school-themed board game that works on sorting and graphing through play! Students must roll or spin across the game board to collect school items and then graph them. Plus, “I Can”...

8th Grade Data and Graphs
MSRP:
Now:
$10.00
Was:
This product is modeled to teach:
8.5(D) use a trend line that approximates the linear relationship between bivariate sets of data to make predictions
8.5(C) contrast bivariate sets...