Description
Looking for a great lesson that encourages collaboration and hands-on experience in creating and making maps, graphs, and/or charts? Or do you need a simple lesson to introduce the concept of population density to your students?
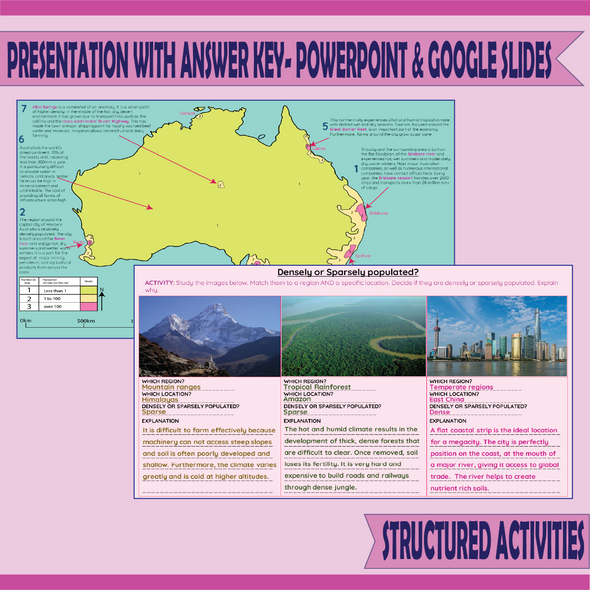
This lesson includes videos, maps presentations, and more to teach students the meaning behind "population density". Students will team up to work collaboratively to create a map, graph or chart depicting the population density of the 7 continents. In addition, they will learn how to calculate population density. Students will analyze their maps, graphs, and charts to compare and contrast the differences and reasons for densely and sparsely population regions and will provide 5 reflection statements based on their observations.
This lesson includes:
Links to Youtube videos
Links to maps
Student activity sheet
Map reproducible
and more.
A Smart Board, or projector with a screen will be needed for this lesson.
Will need to be able to open a ZIP FILE.
Due to links changing and sometimes not able to open, I have included the maps as printables.
Check out my store Geography & Math Made Easy for more resources


