Description
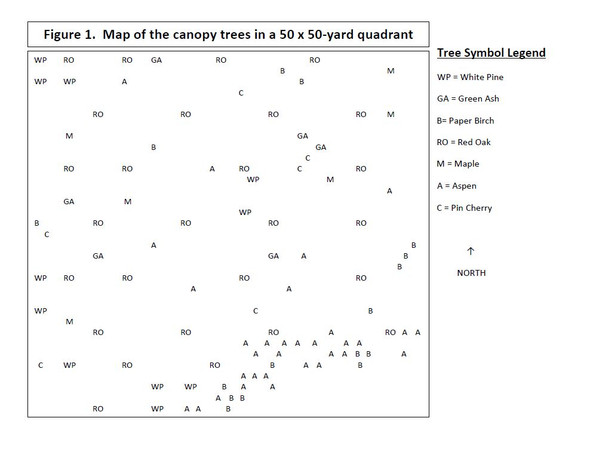
Field scientists, wildlife biologists, ecologists, and foresters are among the specialists who perform grid plot analysis to estimate a species’ population in a larger region. Students participating in this activity will use this technique to determine the populations of moose, whitetail deer, garter snake, and bluegill in their habitats. Each scenario offers a species count in randomly selected plots and a user-friendly layout with the formula for calculating the populations.
This four-page lesson includes conclusion questions and a complete key in color. Once converted to Microsoft Word using Adobe Acrobat, this PDF file will be editable.
I appreciate your interest! I have nearly thirty years of science teaching experience and have over twenty years of publishing experience. I am confident this product will serve you and your students well for years to come!


